Measuring photosynthesis has always been one of the central goals of plant physiology. Understanding how much CO₂ a leaf absorbs, how efficiently it uses water, how stomata respond, and how environmental stress affects carbon gain allows scientists to understand plant performance in a changing world. For decades, the gold standard for these measurements has been infrared gas analysis (IRGA), a technique that quantifies gas exchange between a leaf and its surrounding air. Infrared gas analyzers used in instruments like the LI-6400 and LI-6800—have shaped our understanding of how plants breathe, photosynthesize, and adjust to stress.
But conventional IRGA measurements have one major limitation that they only examine small portions of leaves, often a single square centimeter or less. While they provide highly accurate, quantitative measurements of CO₂ and water exchange, they cannot reveal spatial variability across a leaf. Stress, photoprotection, stomatal patchiness, and photosynthetic heterogeneity often appear in scattered regions long before whole-leaf behavior changes. To fully understand plant function, researchers need both precise gas-exchange data and spatially rich imaging data.
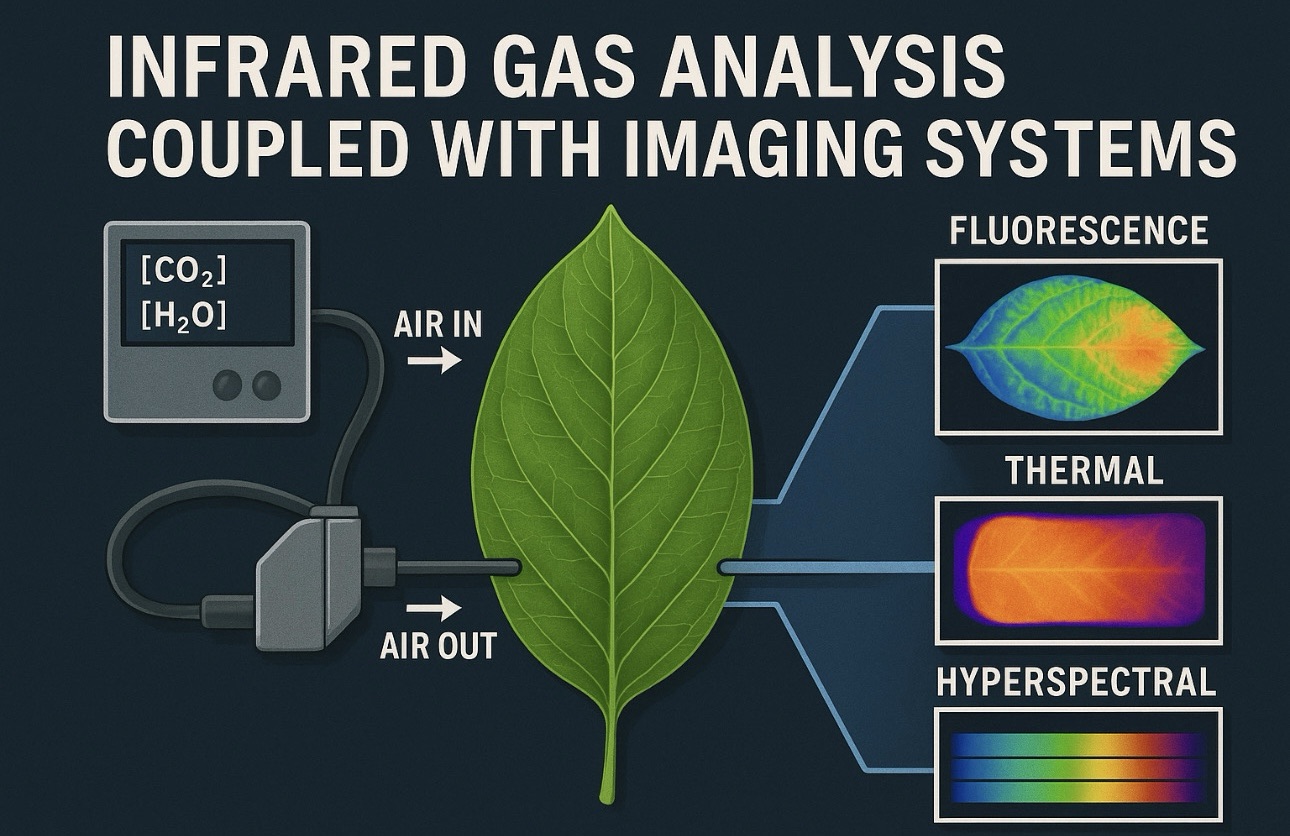
This is where the integration of infrared gas analysis with imaging systems has transformed plant physiology. By coupling IRGAs with techniques like chlorophyll fluorescence imaging, thermal imaging, hyperspectral imaging, and 3D canopy scanning, scientists now capture a multidimensional picture of plant function quantitative rates, spatial patterns, and dynamic physiological shifts all at once. This combination bridges the gap between microscopic precision and macroscopic visualization, allowing the most complete assessment of plant behavior ever achieved.
How Infrared Gas Analysis Works?
Infrared gas analysis measures photosynthesis by detecting tiny changes in CO₂ and water vapor concentration as air passes over a leaf. Inside an IRGA, an infrared beam passes through the air sample, and CO₂ absorbs light at specific wavelengths. By comparing absorption before and after air flows over the leaf, the instrument calculates how much CO₂ the leaf consumed. A similar process measures water loss, giving insights into transpiration and stomatal conductance.
These measurements allow calculation of critical physiological parameters such as net photosynthetic rate (A), stomatal conductance (gs), transpiration rate (E), internal CO₂ concentration (Ci), and intrinsic water-use efficiency (iWUE). Unlike imaging tools, IRGAs provide absolute, numerical values with high precision. They are ideal for understanding the biochemical limits of photosynthesis, modeling CO₂ assimilation, and studying stomatal kinetics or responses to environmental manipulation.
However, IRGAs only measure a tiny portion of the leaf, and leaves are not uniform. Stomata do not open evenly. Stress does not spread evenly. Light absorption varies across veins, margins, and midribs. For years, researchers recognized that gas exchange data did not always represent whole-leaf behavior, but there was no practical solution.
Coupling IRGAs with imaging systems solves this problem elegantly. While IRGA provides high-precision quantitative data, imaging systems reveal where and why photosynthesis varies across a leaf. The combination allows researchers to connect molecular and biochemical processes with visible physiological patterns.
Imaging Systems: Seeing the Spatial Story Behind Gas Exchange
Modern plant imaging systems capture physiological data in ways that gas exchange alone cannot. Different imaging technologies provide different layers of information:
Chlorophyll fluorescence imaging maps photosystem II efficiency, showing photochemical yield, photoinhibition, and energy dissipation. It reveals hotspots of stress long before gas exchange values drop.
Thermal imaging detects subtle changes in leaf temperature associated with stomatal closure, evaporative cooling, and water stress. Warmer patches often indicate stomatal patchiness or hydraulic limitations.
Hyperspectral imaging captures biochemical fingerprints in hundreds of wavelengths, revealing pigment composition, water content, and stress-induced spectral changes.
Multispectral imaging detects broader indices such as NDVI, PRI, and red-edge shifts that correlate with photosynthesis and pigment dynamics.
3D imaging and LiDAR measure leaf angles, canopy architecture, and light interception—structural traits that shape photosynthesis and gas exchange.
When imaging systems are paired with IRGA measurements, spatial patterns suddenly become meaningful. For example, a decrease in photosynthesis detected by the IRGA may correspond to high NPQ regions visible on a fluorescence map, or hot leaf patches on a thermal image, or spectral signatures indicative of pigment breakdown. The integration allows researchers to ask not only how much photosynthesis is occurring, but where, why, and under which structural or stress conditions.
This combined approach is especially useful for uncovering stomatal patchiness areas of leaves where stomata behave differently due to drought, salinity, heat, or hormonal signals. Patchiness alters internal CO₂ flow and biases gas exchange measurements, but imaging reveals the underlying pattern so IRGA data can be correctly interpreted.
Why Coupling IRGA and Imaging Matters?
Stress rarely affects leaves uniformly. Drought can cause isolated zones of stomatal closure. Heat may induce photoprotection in sun-exposed regions while shaded areas remain efficient. Nutrient deficiencies begin as localized patches. Pathogens affect small clusters of cells long before the entire leaf loses function. IRGA alone might record a moderate reduction in photosynthesis, but imaging tells the story behind the numbers.
During drought, IRGA detects reduced photosynthesis and stomatal conductance, but thermal imaging shows the exact patches where stomata close first. Fluorescence maps reveal where photoinhibition begins. Hyperspectral indices detect early pigment changes and water loss. During heat stress, IRGA reveals declines in carbon assimilation, but fluorescence imaging captures PSII damage, while thermal cameras show whether transpiration adequately cools the leaf. During nutrient stress, IRGA measurements may not immediately show declines, but spectral imaging reveals changes in chlorophyll, carotenoids, and nitrogen-related bands before gas exchange responds. During pathogen infection, IRGA captures declines once infection spreads, but fluorescence imaging sees early reductions in Y(II) around infection sites. During high light stress, NPQ maps reveal protective responses, while IRGA quantifies the impact on carbon assimilation.
This synergy between quantitative and spatial data makes the combination of IRGA and imaging one of the most powerful frameworks for modern physiology. It uncovers the mechanisms behind stress resilience and reveals how biochemical, structural, and spatial processes interact to determine whole-leaf performance.
Applications in Crop Breeding
As climate stress intensifies and breeding programs seek more resilient crops, the integration of infrared gas analysis and imaging systems has become indispensable. In breeding trials, dozens or hundreds of genotypes can be screened not only by photosynthetic efficiency but also by spatial resilience patterns. Two genotypes with the same photosynthetic rate may respond very differently under stress one maintaining uniform behavior and another showing severe patchiness. Imaging makes these differences visible, while IRGA quantifies their physiological consequences.
In functional genomics, mutants or CRISPR-edited lines with altered stomatal behavior, mesophyll conductance, photoprotection, or chloroplast structure can be evaluated with much greater accuracy. Fluorescence and thermal maps show the spatial phenotype, while IRGA captures the numerical performance. This dual perspective strengthens the interpretation of gene function.
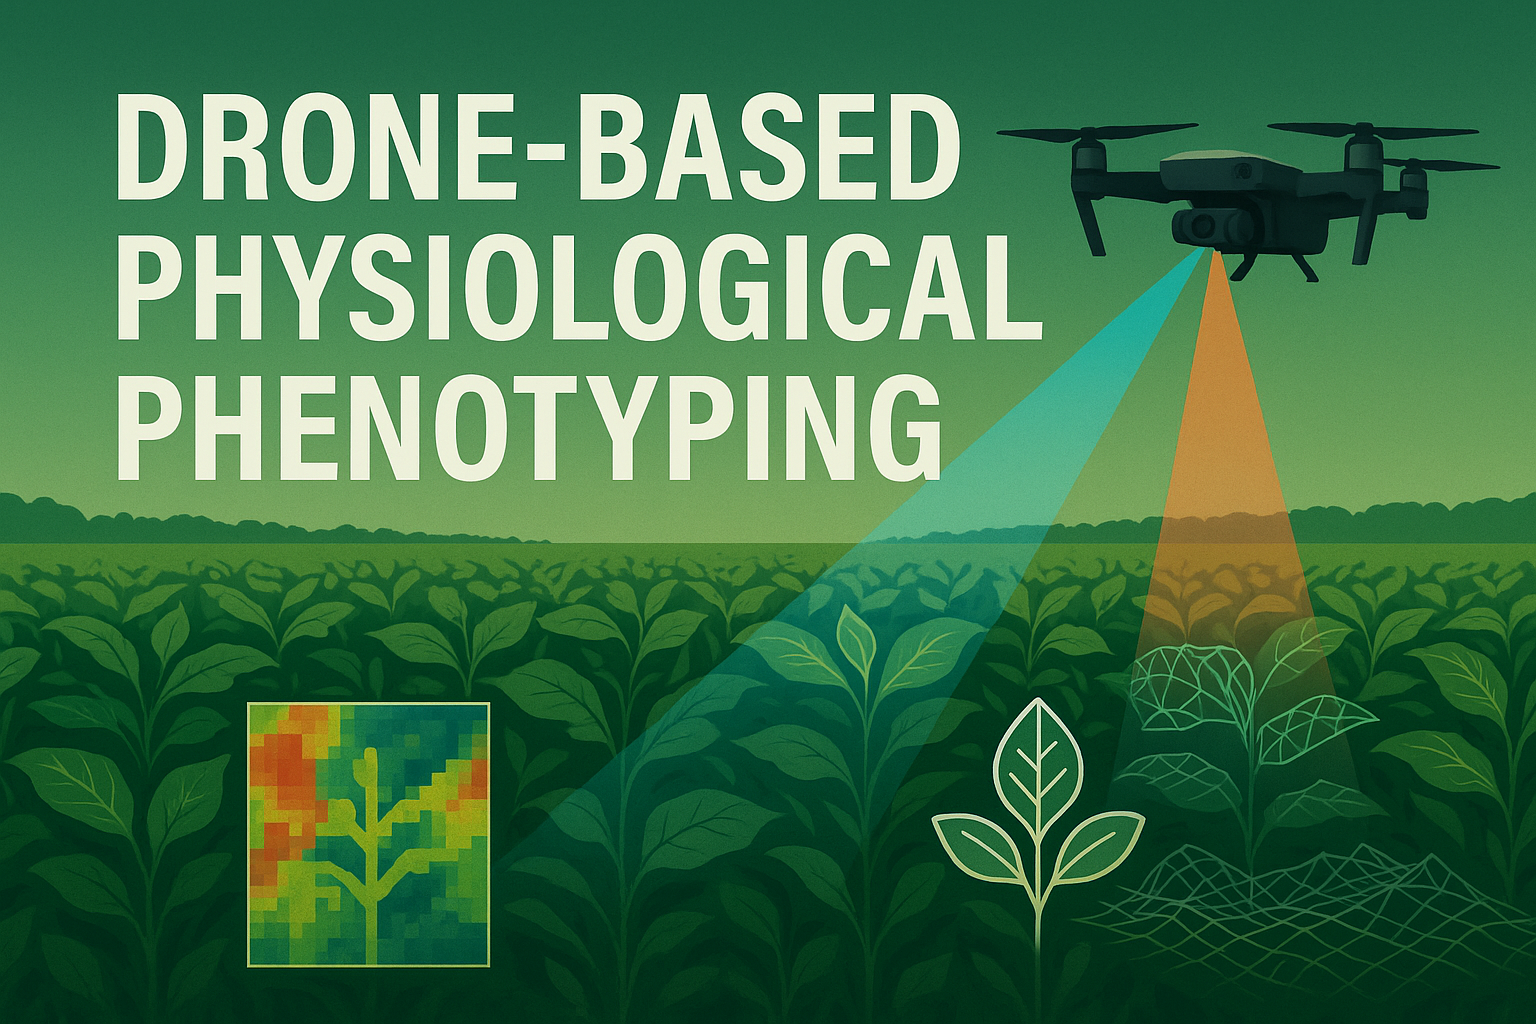
In precision agriculture, coupling remote imaging—drones, satellites with IRGA calibration helps translate field-level spectral or thermal data into photosynthetic estimates. Field-scale IRGA is impossible, but imaging calibrated with controlled gas exchange measurements allows physiologists to extend insights from leaf chambers to entire canopies, making crop monitoring more accurate and actionable.
Together, IRGA and imaging form a foundation for next-generation physiology, connecting molecular mechanisms, leaf behavior, canopy performance, and field outcomes.
Conclusion
Infrared gas analysis changed plant physiology by giving scientists a precise way to measure photosynthesis and water use. Imaging systems transformed the field by revealing where and how physiology varies across leaves and canopies. But the greatest power comes when these tools are united. IRGA provides numerical accuracy. Imaging provides spatial intelligence. Combined, they create a comprehensive picture of plant function quantitative, visual, dynamic, and mechanistic.
As climate change pushes plants to their limits, understanding how photosynthesis breaks down or adapts under stress has never been more critical. Coupling IRGA with imaging is not just a technological innovation; it is a conceptual shift in how we study plants. It allows us to see physiology as a living, spatially complex process, one that unfolds across tissues, landscapes, and environmental gradients. This integrated approach is helping build climate-resilient crops, improve water use, optimize breeding, and deepen our understanding of the most fundamental process sustaining life on Earth.